PHP-FPM Optimization

Hi!
I’m installing a shiny server with PHP 7.4 (jumping from 7.1). I’ve always configured user, group, the number of children according to RAM, and listen parameter, but I haven’t look to other settings.

So please help me understand what those options do.

1./ Starting with listen. TCP or Unix socket? Which one and why? I always use tcp because I have in my head “it has to use something related to network, it must be heavier than the other one”. But actually I don’t know how they work.

2./ emergency_restart_threshold and emergency_restart_interval

; If this number of child processes exit with SIGSEGV or SIGBUS within the time
; interval set by emergency_restart_interval then FPM will restart. A value
; of '0' means 'Off'.
; Default Value: 0
emergency_restart_threshold = 10

; Interval of time used by emergency_restart_interval to determine when
; a graceful restart will be initiated.  This can be useful to work around
; accidental corruptions in an accelerator's shared memory.
; Available Units: s(econds), m(inutes), h(ours), or d(ays)
; Default Unit: seconds
; Default Value: 0
emergency_restart_interval = 1m

I see a lot of tutorials using emergency_restart_interval = 1m, but I’m not sure they know what they are doing. How does it work? If 10 processes fail in 1 minute, fpm will restart?

Thanks.

It all boils down to your setup. Unix socket should be preferred for localhost, since you’re theoretically adding an overhead if you pick TCP. OTOH, the overhead with TCP should be negligible and the configuration could be more portable. @eva2000 may have further specific insights

Well yes; according to PHP docs definition of emergency_restart_threshold,

If this number of child processes exit with SIGSEGV or SIGBUS within the time interval set by emergency_restart_interval, then FPM will restart.

1 Like

UDS will allow some form of authentication via DACs (traditional Unix permissions). TCP anyone locally on the server may connect. If memory serves me correct, UDS is 8x faster than TCP. When you’re looking on the scale of microseconds this is negligible.

1 Like

If Unix socket is better, why TCP is the default?

I just change a line in the config but this is a small server. I guess with larger setups there is a lot more to configure.

It’s universally easier to understand than providing a path, which may or may not be jailed (or namespaced) and UNIX permissions which may or may not be adequate for the specific user configured as the web user.

Goes hand-in-hand with why most security practices are so terrible, the simplest approach gets prescribed.

2 Likes

Unix sockets should be preferred for processes running on the same box but they may not the best option if you’re de-coupling backend and frontend in the perspective of scaling up/down your boxes, at least in some cases (e.g. old-fashioned clusters), whilst TCP is the “jack of all trades”. Also, TCP is sometimes simpler and it “just works” in the scenarios depicted by nem, despite the above-mentioned pitfalls; some admins prefer to filter packets rather than fixing file permissions. If I had a cent for every daring file permissions put in place just because it’s easier…

2 Likes

Thank you guys!

I will keep it as Unix socket.

In theory, yes. But in real life, really depends. For PHP-FPM specifically for concurrent request/user scalability with Nginx pairing, TCP is better than Unix Socket (provided you properly tune TCP to handle it).

You can see this play out in benchmarks I did comparing performance of different LEMP stacks Centmin Mod vs Easyengine vs Webinoly vs VestaCP vs OneInStack - some that use Unix Sockets and some that use TCP for PHP-FPM.

Summary of all benchmarks https://servermanager.guide/131/centmin-mod-vs-easyengine-vs-webinoly-vs-vestacp-vs-oneinstack-lemp-stack-benchmarks/

But specifics for PHP-FPM benchmarks at https://community.centminmod.com/threads/php-7-x-benchmarks-centmin-mod-vs-easyengine-vs-webinoly-vs-vestacp-vs-oneinstack.14988/ and actual PHP-FPM confgs for them here. OneInStack uses Unix Sockets when I tested and they’re the ones to first fail at higher concurrency load tests compared to Nginx/PHP-FPM stacks which used TCP.

a quote for context

  • OneInStack LEMP stacks default to PHP-FPM Unix Sockets unlike other LEMP stacks tested defaulting to TCP listeners. So at 500 user concurrency, OneInStack PHP-FPM configs start to fail under the h2load load tester tool. Between 35-38% of all requests failed which in turn inflates and skews the requests/s and TTFB 99% percentile latency values. Requests per second and latency is based on the time to complete a request and thus failed requests resulted in h2load reporting higher requests/s and lower TTFB 99% percentile latency values. You do not want to be using PHP-FPM Unix Sockets under high concurrent user loads when almost 2/5 requests fail!
  • h2load requests/s numbers along won’t show the complete picture until you factor into request latency. In this case I added to the chart the 99% percentile value for Time To First Byte (TTFB). Meaning 99% of the time, requests had such latency response times. Here Webinoly had a decent requests/s but much higher TTFB due to one of the 9x test runs stalling and thus resulting in minimum requests/s dropping to just 265.33. EasyEngine also had one of the 9x test runs stall and thus dropped requests/s to 240.3.
  • Only Centmin Mod no-pgo/pgo and VestaCP and Webinoly managed to complete 100% of the requests but VestaCP’s TTFB 99% percentile value was twice as slow and Webinoly was 5x times slower than that of Centmin Mod’s PHP-FPM performance.

chart

At low concurrency = 50 users for hello.php much closer https://community.centminmod.com/threads/php-7-x-benchmarks-centmin-mod-vs-easyengine-vs-webinoly-vs-vestacp-vs-oneinstack.14988/#post-64336

  • TTFB min, average and max latency response numbers in milliseconds (ms) where lower equal faster response times and thus ultimately faster page load speed. These numbers are the average of 9x h2load test runs
  • TTFB average shows Centmin Mod PHP-FPM having fastest response times, followed by VestaCP, EasyEngine, OneInStack OpenResty, OneInStack Nginx and in last place with almost 2x times slower TTFB min, Webinoly.
  • TTFB maximum shows Centmin Mod PHP-FPM having fastest response times, followed by VestaCP, EasyEngine, OneInStack OpenResty, OneInStack Nginx and in last place with almost 2x times slower TTFB maximum, Webinoly.

And finally ultra high user concurrency tests at 1000, 2000 and 5000 users at https://community.centminmod.com/threads/php-7-x-benchmarks-centmin-mod-vs-easyengine-vs-webinoly-vs-vestacp-vs-oneinstack.14988/#post-64347 (hint at 5,000 user concurrency OneInStack Unix Socket PHP-FPM setup only managed to serve 11-13% completed requests !)

Now to test very high 1000 & 2000 + bonus 5000 user concurrency and again looking at PHP-FPM response time latency i.e. TTFB rather than pure throughput (requests/s) and also looking at percentage of completed requests. Only Centmin Mod LEMP stack’s PHP-FPM managed to serve 100% of the requests. Though the response times are less than ideal, the results do show exactly how well each respective LEMP stack handles high user concurrency with out of the box defaults. Granted, Nginx and PHP-FPM settings can be changed and tuned to be more optimal for all LEMP stacks.

4 Likes

I’m not so sure if this isn’t an anomalous response with h2load and unix sockets. Did you test UDS with say hey, wrk, or something else? If we take Redis for example, sockets are marginally faster as long as it doesn’t hit hardware abstraction.

image

I was able to reproduce the same connectivity issues with just h2load, but not wrk nor hey. Here’s a histogram for hey with UDS vs TCP.

/bin/hey_linux_amd64 -h2 -cpus 1 -n 5000 -c 500 http://benchmark.test/hello.php

UDS

Summary:
Total: 1.9834 secs
Slowest: 1.0147 secs
Fastest: 0.0012 secs
Average: 0.1570 secs

  0.001 [1]     |
  0.103 [3432]  |■■■■■■■■■■■■■■■■■■■■■■■■■■■■■■■■■■■■■■■■
  0.204 [586]   |■■■■■■■
  0.305 [178]   |■■
  0.407 [140]   |■■
  0.508 [337]   |■■■■
  0.609 [89]    |■
  0.711 [70]    |■
  0.812 [123]   |■
  0.913 [38]    |
  1.015 [6]     |

TCP

Summary:
Total: 2.4079 secs
Slowest: 0.9840 secs
Fastest: 0.0014 secs
Average: 0.1881 secs
Requests/sec: 2076.5372

  0.001 [1]     |
  0.100 [3172]  |■■■■■■■■■■■■■■■■■■■■■■■■■■■■■■■■■■■■■■■■
  0.198 [313]   |■■■■
  0.296 [240]   |■■■
  0.394 [268]   |■■■
  0.493 [69]    |■
  0.591 [292]   |■■■■
  0.689 [367]   |■■■■■
  0.787 [182]   |■■
  0.886 [87]    |■
  0.984 [9]     |

wrk corroborates these findings:

via ./wrk -t1 -c500 -d15s http://benchmark.test/hello.php

UDS

Running 15s test @ http://benchmark.test/hello.php
  1 threads and 500 connections
  Thread Stats   Avg      Stdev     Max   +/- Stdev
    Latency   104.31ms  162.31ms   2.00s    94.15%
    Req/Sec     2.63k   135.29     3.05k    76.51%
  39312 requests in 15.04s, 9.24MB read
  Socket errors: connect 0, read 2414, write 0, timeout 1157
Requests/sec:   2613.18
Transfer/sec:    629.17KB

TCP

Running 15s test @ http://benchmark.test/hello.php
  1 threads and 500 connections
  Thread Stats   Avg      Stdev     Max   +/- Stdev
    Latency   160.47ms  194.28ms   1.99s    87.92%
    Req/Sec     2.26k   155.49     3.06k    79.73%
  33695 requests in 15.01s, 7.96MB read
  Socket errors: connect 0, read 2918, write 0, timeout 439
Requests/sec:   2245.43
Transfer/sec:    542.89KB

Similarly, wrk reports anomalous read/timeout failures for both UDS + TCP. h2load didn’t report failures for TCP, but did UDS. hey reported zero failures for either PHP-FPM backing.

So long as net.core.somaxconn can accommodate the UDS backlog (default: 128) there shouldn’t be interruption. My suspicion is something’s confounded in the testing methodology using h2load. wrk’s a crapshoot if we look at its reported error rates.

At least on paper UDS is faster than TCP. Why you got the results you did might lend some insight as to what might’ve been misconfigured. somaxconn and if the socket is governed by systemd, [Socket] => Backlog would also have an effect.

2 Likes

OK, this thread got a new level :joy:

3 Likes

Yes redis unix sockets is faster and scales better than TCP. But nginx/php-fpm with TCP scales better than PHP-FPM unix sockets. Try at 1,000 to 5,000 user concurrency and see and test with HTTPS vs HTTP.

It’s probably to do with nginx+php-fpm pairing as Nginx Unit application server’s PHP-FPM standalone with with embedded PHP Configuration — NGINX Unit is faster when tested without Nginx server. But once you put Nginx in front it isn’t in traditional Nginx + PHP-FPM setups.

3 Likes

My testing was done with Apache 2.4; however, I had similar failure rates with PHP-FPM + UDS with h2load as you encountered on NGINX that I could not reproduce with hey.

h2load producing a bevvy of UDS errors, hey saying there’s none of the sort, wrk throwing errors with both TCP and UDS and the fact I had similar connection errors with h2load/Apache suggests there’s a deeper issue - perhaps protocol conformity - with PHP-FPM + UDS beyond how NGINX handles pooling.

Is this something you’ve dug into to account for the discrepancies? It may be 2020, but the testing is unreliable if 3 benchmarking suites report varying success rates. :sweat_smile:

2 Likes

Might come down to system kernel/TCP environments too? But really haven’t dug into much beyond testing at https://community.centminmod.com/threads/php-7-x-benchmarks-centmin-mod-vs-easyengine-vs-webinoly-vs-vestacp-vs-oneinstack.14988/ which is much in line with previous Unix Socket vs TCP PHP-FPM tests.

I’m not getting such errors for my Centmin Mod LEMP stack’s Nginx/PHP-FPM configs on CentOS 7.8. I mainly use my forked wrk version, wrk-cmm at GitHub - centminmod/wrk at centminmod and h2load built with HTTP/2 and another h2load build for HTTP/3 support testing.

h2load --version
h2load nghttp2/1.33.0
h2load-http3 --version
h2load nghttp2/1.42.0-DEV
wrk-cmm -v
wrk 4.1.0-31-ge2a8161 [epoll] Copyright (C) 2012 Will Glozer
Usage: wrk <options> <url>                            
  Options:                                            
    -c, --connections <N>  Connections to keep open   
    -d, --duration    <T>  Duration of test           
    -t, --threads     <N>  Number of threads to use   
                                                      
    -b, --bind-ip     <S>  Source IP (or CIDR mask)   
                                                      
    -s, --script      <S>  Load Lua script file       
    -H, --header      <H>  Add header to request      
        --latency          Print latency statistics   
        --breakout         Print breakout statistics  
        --timeout     <T>  Socket/request timeout     
    -v, --version          Print version details      
                                                      
  Numeric arguments may include a SI unit (1k, 1M, 1G)
  Time arguments may include a time unit (2s, 2m, 2h)

I also use same h2load for testing Wordpress Cache Enabler plugin’s caching of query strings to 25,000 concurrent users without issue https://community.centminmod.com/threads/centmin-sh-menu-22-add-wpcli_ce_querystring_included-n-in-123-09beta01.20291/#post-85929

h2load -t4 -c25000 -n100000 -m60 https://cache-enabler2.domain.com/?fbclid 
starting benchmark...
spawning thread #0: 6250 total client(s). 25000 total requests
spawning thread #1: 6250 total client(s). 25000 total requests
spawning thread #2: 6250 total client(s). 25000 total requests
spawning thread #3: 6250 total client(s). 25000 total requests
TLS Protocol: TLSv1.2
Cipher: ECDHE-ECDSA-AES128-GCM-SHA256
Server Temp Key: ECDH P-256 256 bits
Application protocol: h2
progress: 10% done
progress: 20% done
progress: 30% done
progress: 40% done
progress: 50% done
progress: 60% done
progress: 70% done
progress: 80% done
progress: 90% done
progress: 100% done
finished in 10.89s, 9182.13 req/s, 203.94MB/s
requests: 100000 total, 100000 started, 100000 done, 100000 succeeded, 0 failed, 0 errored, 0 timeout
status codes: 100000 2xx, 0 3xx, 0 4xx, 0 5xx
traffic: 2.17GB (2328900000) total, 6.75MB (7075000) headers (space savings 79.67%), 2.16GB (2317000000) data
                     min         max         mean         sd        +/- sd
time for request:   807.17ms       4.19s       2.69s       1.02s    52.84%
time for connect:   864.58ms       6.87s       6.02s       1.05s    94.52%
time to 1st byte:      1.72s      10.85s       8.71s       1.42s    59.54%
req/s           :       0.37        2.32        0.47        0.09    70.12%

while wrk-cmm gets to around 8,000 user concurrency before errors start showing

wrk-cmm -t4 -c8000 -d20s --latency --breakout https://cache-enabler2.domain.com/?fbclid
Running 20s test @ https://cache-enabler2.domain.com/?fbclid
  4 threads and 8000 connections
  Thread Stats   Avg      Stdev     Max   +/- Stdev
    Latency   471.60ms  107.52ms   1.51s    94.76%
    Connect     1.13s   371.20ms   1.93s    61.77%
    TTFB       61.30ms  118.71ms   1.22s    95.98%
    TTLB      408.73ms   48.79ms 505.90ms   86.50%
    Req/Sec     4.11k     1.21k    8.68k    73.09%
  Latency Distribution
     50%  455.92ms
     75%  481.49ms
     90%  508.53ms
     95%  542.96ms
     99%    1.06s
  297178 requests in 20.04s, 6.61GB read
Requests/sec:  14827.88
Transfer/sec:    337.95MB

at 10k user concurrency errors start to show for Wordpress query string cache tests

wrk-cmm -t4 -c10000 -d20s --latency --breakout https://cache-enabler2.domain.com/?fbclid 
Running 20s test @ https://cache-enabler2.domain.com/?fbclid
  4 threads and 10000 connections
unable to record connect
  Thread Stats   Avg      Stdev     Max   +/- Stdev
    Latency   592.98ms  160.59ms   2.00s    93.68%
    Connect     1.35s   365.05ms   2.00s    58.46%
    TTFB       86.39ms  192.70ms   1.77s    95.12%
    TTLB      506.25ms   59.36ms 607.79ms   89.16%
    Req/Sec     4.15k     1.19k    8.72k    72.76%
  Latency Distribution
     50%  564.29ms
     75%  591.87ms
     90%  625.28ms
     95%  765.25ms
     99%    1.53s 
  286391 requests in 20.11s, 6.40GB read
  Socket errors: connect 0, read 3, write 0, timeout 280
  Non-2xx or 3xx responses: 1
Requests/sec:  14238.60
Transfer/sec:    325.73MB

True, benchmarking is always relative to ones own tests / server environments. So could be the case. Either way folks just use whichever setup is best for their needs and for mine it’s clearly PHP-FPM via TCP :slight_smile:

3 Likes

@eva2000 Does Centmin Mod have a installer for PHP 7.4? I only see 7.3 in beta.

https://centminmod.com/betainstaller74.sh

yum -y update; curl -O https://centminmod.com/betainstaller74.sh && chmod 0700 betainstaller74.sh && bash betainstaller74.sh

2 Likes

it does as @vovler posted :slight_smile:

After install, you can also play with PHP 8.0 betas via centmin.sh menu option 5 upgrade routine too https://community.centminmod.com/threads/php-8-0-0beta1-download-update-in-123-09beta01.20136/

1 Like

This discussion has me curious so I tested my Centmin Mod LEMP stack with PHP-FPM unix sockets on CentOS 7.8 64bit and with PHP 8.0.0beta3 and scaling is way better than I remember unix sockets to be for at least hello.php tests. Managed to push to 60,000 concurrent users with wrk-cmm with bind source IP mode to workaround port exhaustion

wrk-cmm -b 127.0.0.1/27 -t1 -c60000 -d15s --latency --breakout http://localhost/hello.php; ss -s; netstat -l | grep php; 
Running 15s test @ http://localhost/hello.php
  1 threads and 60000 connections
  Thread Stats   Avg      Stdev     Max   +/- Stdev
    Latency     1.66s   227.26ms   1.79s    88.34%
    Connect   968.04ms  424.74ms   1.75s    58.10%
    TTFB        1.66s   227.26ms   1.79s    88.34%
    TTLB        2.44us    0.85us  35.00us   94.26%
    Req/Sec    34.23k     2.78k   41.39k    91.67%
  Latency Distribution
     50%    1.74s 
     75%    1.76s 
     90%    1.78s 
     95%    1.78s 
     99%    1.78s 
  422717 requests in 15.10s, 134.24MB read
Requests/sec:  27994.36
Transfer/sec:      8.89MB
Total: 7122 (kernel 9319)

TCP:   107998 (estab 2, closed 102807, orphaned 1740, synrecv 0, timewait 102807/0), ports 0

Transport Total     IP        IPv6
*         9319      -         -        
RAW       0         0         0        
UDP       2         1         1        
TCP       5191      5184      7        
INET      5193      5185      8        
FRAG      0         0         0        

unix  2      [ ACC ]     STREAM     LISTENING     34904346 /var/run/php-fpm/php-fpm.sock
php -v
PHP 8.0.0beta3 (cli) (built: Sep  1 2020 20:07:51) ( NTS )
Copyright (c) The PHP Group
Zend Engine v4.0.0-dev, Copyright (c) Zend Technologies
    with Zend OPcache v8.0.0beta3, Copyright (c), by Zend Technologies

Looks like PHP 8.0.0beta3 is scaling way better than PHP 7.4.9. For PHP 8.0.0 beta3 unix sockets pushed to 60,000 concurrent hello.php requests without errors and TCP on port 9000 pushed to 50,000 concurrent hello.php requests without errors

wrk-cmm -b 127.0.0.1/27 -t1 -c50000 -d15s --latency --breakout http://localhost/hello.php; ss -s; netstat -plant | grep php; 
Running 15s test @ http://localhost/hello.php
  1 threads and 50000 connections
  Thread Stats   Avg      Stdev     Max   +/- Stdev
    Latency     1.78s   244.26ms   1.99s    88.86%
    Connect   815.33ms  357.13ms   1.45s    57.62%
    TTFB        1.78s   244.26ms   1.99s    88.86%
    TTLB        2.62us    1.11us 136.00us   94.82%
    Req/Sec    26.60k     2.63k   28.18k    95.24%
  Latency Distribution
     50%    1.85s 
     75%    1.87s 
     90%    1.89s 
     95%    1.97s 
     99%    1.98s 
  338359 requests in 15.11s, 107.45MB read
Requests/sec:  22388.07
Transfer/sec:      7.11MB
Total: 3925 (kernel 5073)
TCP:   153200 (estab 3573, closed 101428, orphaned 4683, synrecv 0, timewait 101427/0), ports 0

Transport Total     IP        IPv6
*         5073      -         -        
RAW       0         0         0        
UDP       4         3         1        
TCP       51772     51766     6        
INET      51776     51769     7        
FRAG      0         0         0        

tcp    41715      0 127.0.0.1:9000          0.0.0.0:*               LISTEN      15096/php-fpm: mast 

PHP 8 is dam fine !

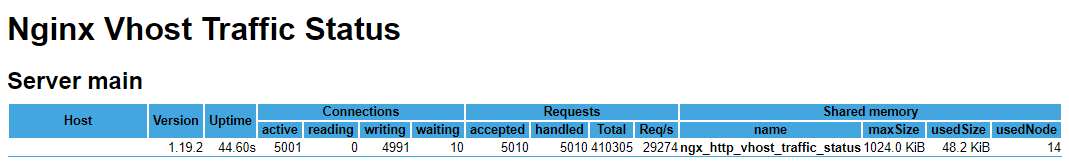
edit: at 5,000 user concurrency tested TCP vs Unix Socket PHP 8.0.0beta3 again and wrk-cmm doesn’t show errors but enabling Nginx vhosts stats and monitoring my upstreams, I see nginx is recording unix socket errors in 4xx which according to logs is 499 errors. While PHP-FPM TCP ran without errors.

edit:

For completeness, tested with latest hey too, seems unix sockets is showing good performance and scalability for once compared to TCP for PHP-FPM. Previous tests haven’t shown such good scalability for concurrent users for unix sockets !

hey non-https benchmarks with 5,000 concurrent users and 100k requests and 1 cpu core

PHP-FPM Unix sockets ~1.39% faster than TCP

TCP

hey -cpus 1 -n 100000 -c 5000 http://localhost/hello.php

Summary:
  Total:        16.2777 secs
  Slowest:      3.1469 secs
  Fastest:      0.0011 secs
  Average:      0.7833 secs
  Requests/sec: 6143.3903
  

Response time histogram:
  0.001 [1]     |
  0.316 [635]   |
  0.630 [3924]  |■■
  0.945 [91507] |■■■■■■■■■■■■■■■■■■■■■■■■■■■■■■■■■■■■■■■■
  1.259 [39]    |
  1.574 [2474]  |■
  1.889 [1204]  |■
  2.203 [60]    |
  2.518 [153]   |
  2.832 [0]     |
  3.147 [3]     |


Latency distribution:
  10% in 0.6540 secs
  25% in 0.7340 secs
  50% in 0.7829 secs
  75% in 0.7999 secs
  90% in 0.8169 secs
  95% in 0.8663 secs
  99% in 1.5877 secs

Details (average, fastest, slowest):
  DNS+dialup:   0.0211 secs, 0.0011 secs, 3.1469 secs
  DNS-lookup:   0.0000 secs, 0.0000 secs, 0.0235 secs
  req write:    0.0106 secs, 0.0000 secs, 1.2172 secs
  resp wait:    0.7457 secs, 0.0010 secs, 1.6507 secs
  resp read:    0.0030 secs, 0.0000 secs, 0.8266 secs

Status code distribution:
  [200] 100000 responses

Unix Sockets

hey -cpus 1 -n 100000 -c 5000 http://localhost/hello.php

Summary:
  Total:        16.0537 secs
  Slowest:      2.9224 secs
  Fastest:      0.0008 secs
  Average:      0.7718 secs
  Requests/sec: 6229.0776
  

Response time histogram:
  0.001 [1]     |
  0.293 [476]   |
  0.585 [2522]  |■
  0.877 [92117] |■■■■■■■■■■■■■■■■■■■■■■■■■■■■■■■■■■■■■■■■
  1.169 [888]   |
  1.462 [1624]  |■
  1.754 [2181]  |■
  2.046 [44]    |
  2.338 [108]   |
  2.630 [38]    |
  2.922 [1]     |


Latency distribution:
  10% in 0.6372 secs
  25% in 0.7155 secs
  50% in 0.7736 secs
  75% in 0.7853 secs
  90% in 0.8008 secs
  95% in 0.8673 secs
  99% in 1.5896 secs

Details (average, fastest, slowest):
  DNS+dialup:   0.0204 secs, 0.0008 secs, 2.9224 secs
  DNS-lookup:   0.0000 secs, 0.0000 secs, 0.5269 secs
  req write:    0.0110 secs, 0.0000 secs, 1.2326 secs
  resp wait:    0.7339 secs, 0.0007 secs, 1.8985 secs
  resp read:    0.0030 secs, 0.0000 secs, 0.8072 secs

Status code distribution:
  [200] 100000 responses

So really not much between then provided both or either TCP and Unix Socket setup is optimally configured.

4 Likes

Thanks for the results. I’ll play around with your environment hopefully by next week if time permits.

That’s the screwy thing. I had errors out the wazoo with CentOS 7 with h2load and wrk. I’m curious whether this is a low-level issue with the API, either kernel or code maturity, that’s inducing that response. Your followup, a 26% increase in throughput with UDS, in CentOS 8 corroborates what I’d expect all things being equal.

Thank you for your work so far! :smiley:

2 Likes

Might come down to how PHP-FPM is configured ultimately. FYI, for me I don’t use persistent keep alive connections with PHP-FPM TCP upstream which allows PHP-FPM to handle more concurrent user connections. If I do use keep alive persistent connections with PHP-FPM TCP upstream, I get 25-33% more throughput but way lower user concurrency scaling.

2 Likes

I am waiting centmintmod port for debian distro, from your test result it’s performance very good compared with other LEMP stack…