Hello, i recently switched to use aa panel with ols on a new server.
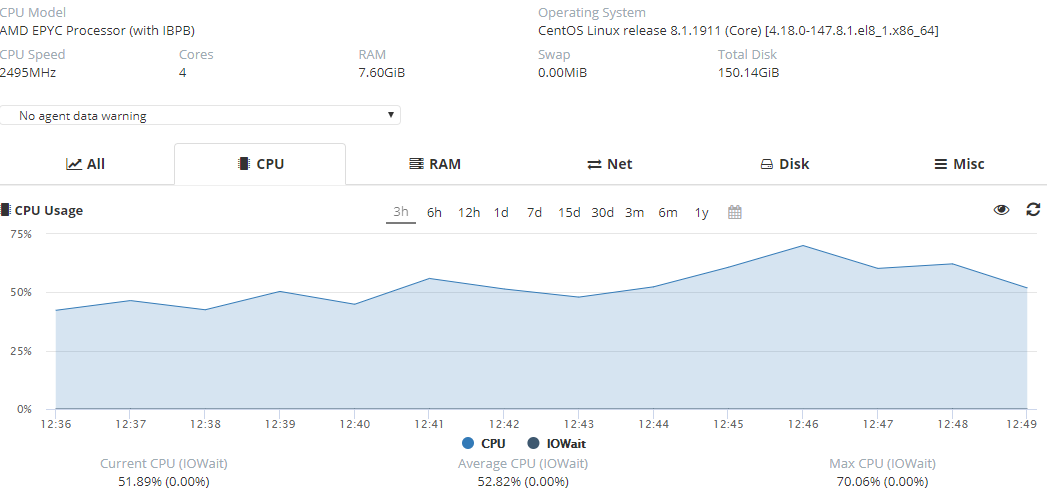
Everything is ok except my server shows is using 50% cpu on hetrixtools monitoring agent, also my control panel monitoring show me random spikes from 5 to 100% cpu usage
The outputs match, HetrixTools just shows the aggregated usage across the various metrics.
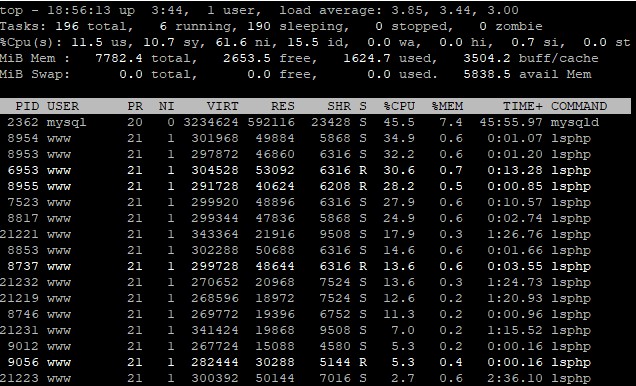
11.5% is used by userspace programs. 10.7% by system processes, 61.6% by niced tasks, 0.7% by soft irqs.
If you sum that together, that’s 84.5% usage. (You can also calculate it like 100% - 15.5% (idle value) == 84.5% usage)
Top shows instantaneous values mind you, not averaged over time.